Urikalish's Riddle
Let’s assume there’s a deadly disease that affects 1 in every 10 people.
Let's say there’s a pretty good test for this disease which is 90% accurate (that means that if a person is sick – the test will say he’s sick in 90% of the cases, and if a person is healthy – the test will say he’s healthy in 90% of the cases).
Now, assuming you took this 90% accurate test, and got a positive result that implies that you are sick - what are the odds that you are really sick?
Bayes's Theorem
The key to solving this riddle is Bayes's Theorem. Don't ask me why. I'm an elitist and I don't need to explain myself to the likes of you. Especially when I have no idea what I'm talking about.

- P(A|B): This is the probability of A, given B. This is what you are looking for. This is the posterior or revised probability that you have the disease, given the fact that you test positive.
- P(B|A): This is the conditional probability, or the probability of B given A. In other words, the probability that you test positive, given that you have the disease.
- P(A): This is the prior probability of A, or the prior probability that you have the disease, regardless of whether your test is positive or not.
- P(B): This is the prior probability of B, or the prior probability that you test positive, whether you have the disease or not.
Smart people can fill in the data directly from Urikalish's riddle into Bayes's Theorem and get a result. Unfortunately, I played more with the glue and crayons than with the abacus and the clay when I was a kid, so I need something simpler.
An Intuitive Explanation of Bayes's Theorem
Eliezer S. Yudkowsky, that boy genius who tells us about his AI (that is, Almost Implemented) research, has the remarkable ability to make some really, really smart stuff seem really, really simple. This is Yudkowsky's explanation of Bayes's Theorem, which still went over my head (must've been toxic glue), so I tried something that is even more simple and more familiar to me, namely decision trees.
Using Decision Trees in Bayesian Analysis
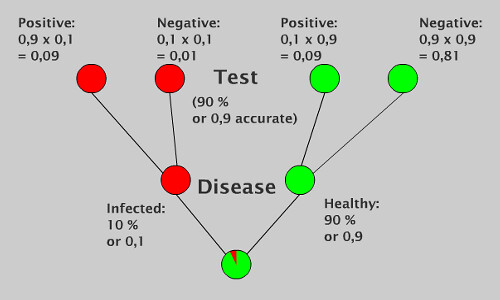
Start at the beginning and make a split for those who have the disease, and those who are healthy. Branching of each node of the tree has to add up to 1, otherwise you're cooking Dutch books. Proceed up the tree, splitting each node into all the possible scenarios, and you'll eventually cover your entire sample space and thus have a visual representation of your full joint distribution.

Explanation
The probability of having the disease is equal to the amount of people who have the disease and test positive, divided by the total number of people who test positive.
If you said 90%, you are stating the probability that the test is right. This is a different probability than having the disease. If you said 10%, you are stating the probability that anybody has the disease, regardless of taking the test or not. The probability of having the disease is affected by both the probability that the test is right and the rarity of the disease.
The total number of people who have the disease here is 0,1, which is 10 %, or 10 out of the 100. The total number of people who test positive is 0,1 x 0,9 for those who have the disease (or 9 out of the original 100), and 0,9 x 0,1 of those who do not have the disease (also 9 out of the original 100). This means the total amount of people who test positive in the original population is 18 out of 100.
Finally, your answer 0,5 ie 50%. You get this from the 9 who test positive and do have the disease divided by 18 who test positive in the total population. The decision tree makes it visible who tested positive, so you are less likely to get confused. How likely? I don't know, draw your own damn tree.


No comments:
Post a Comment